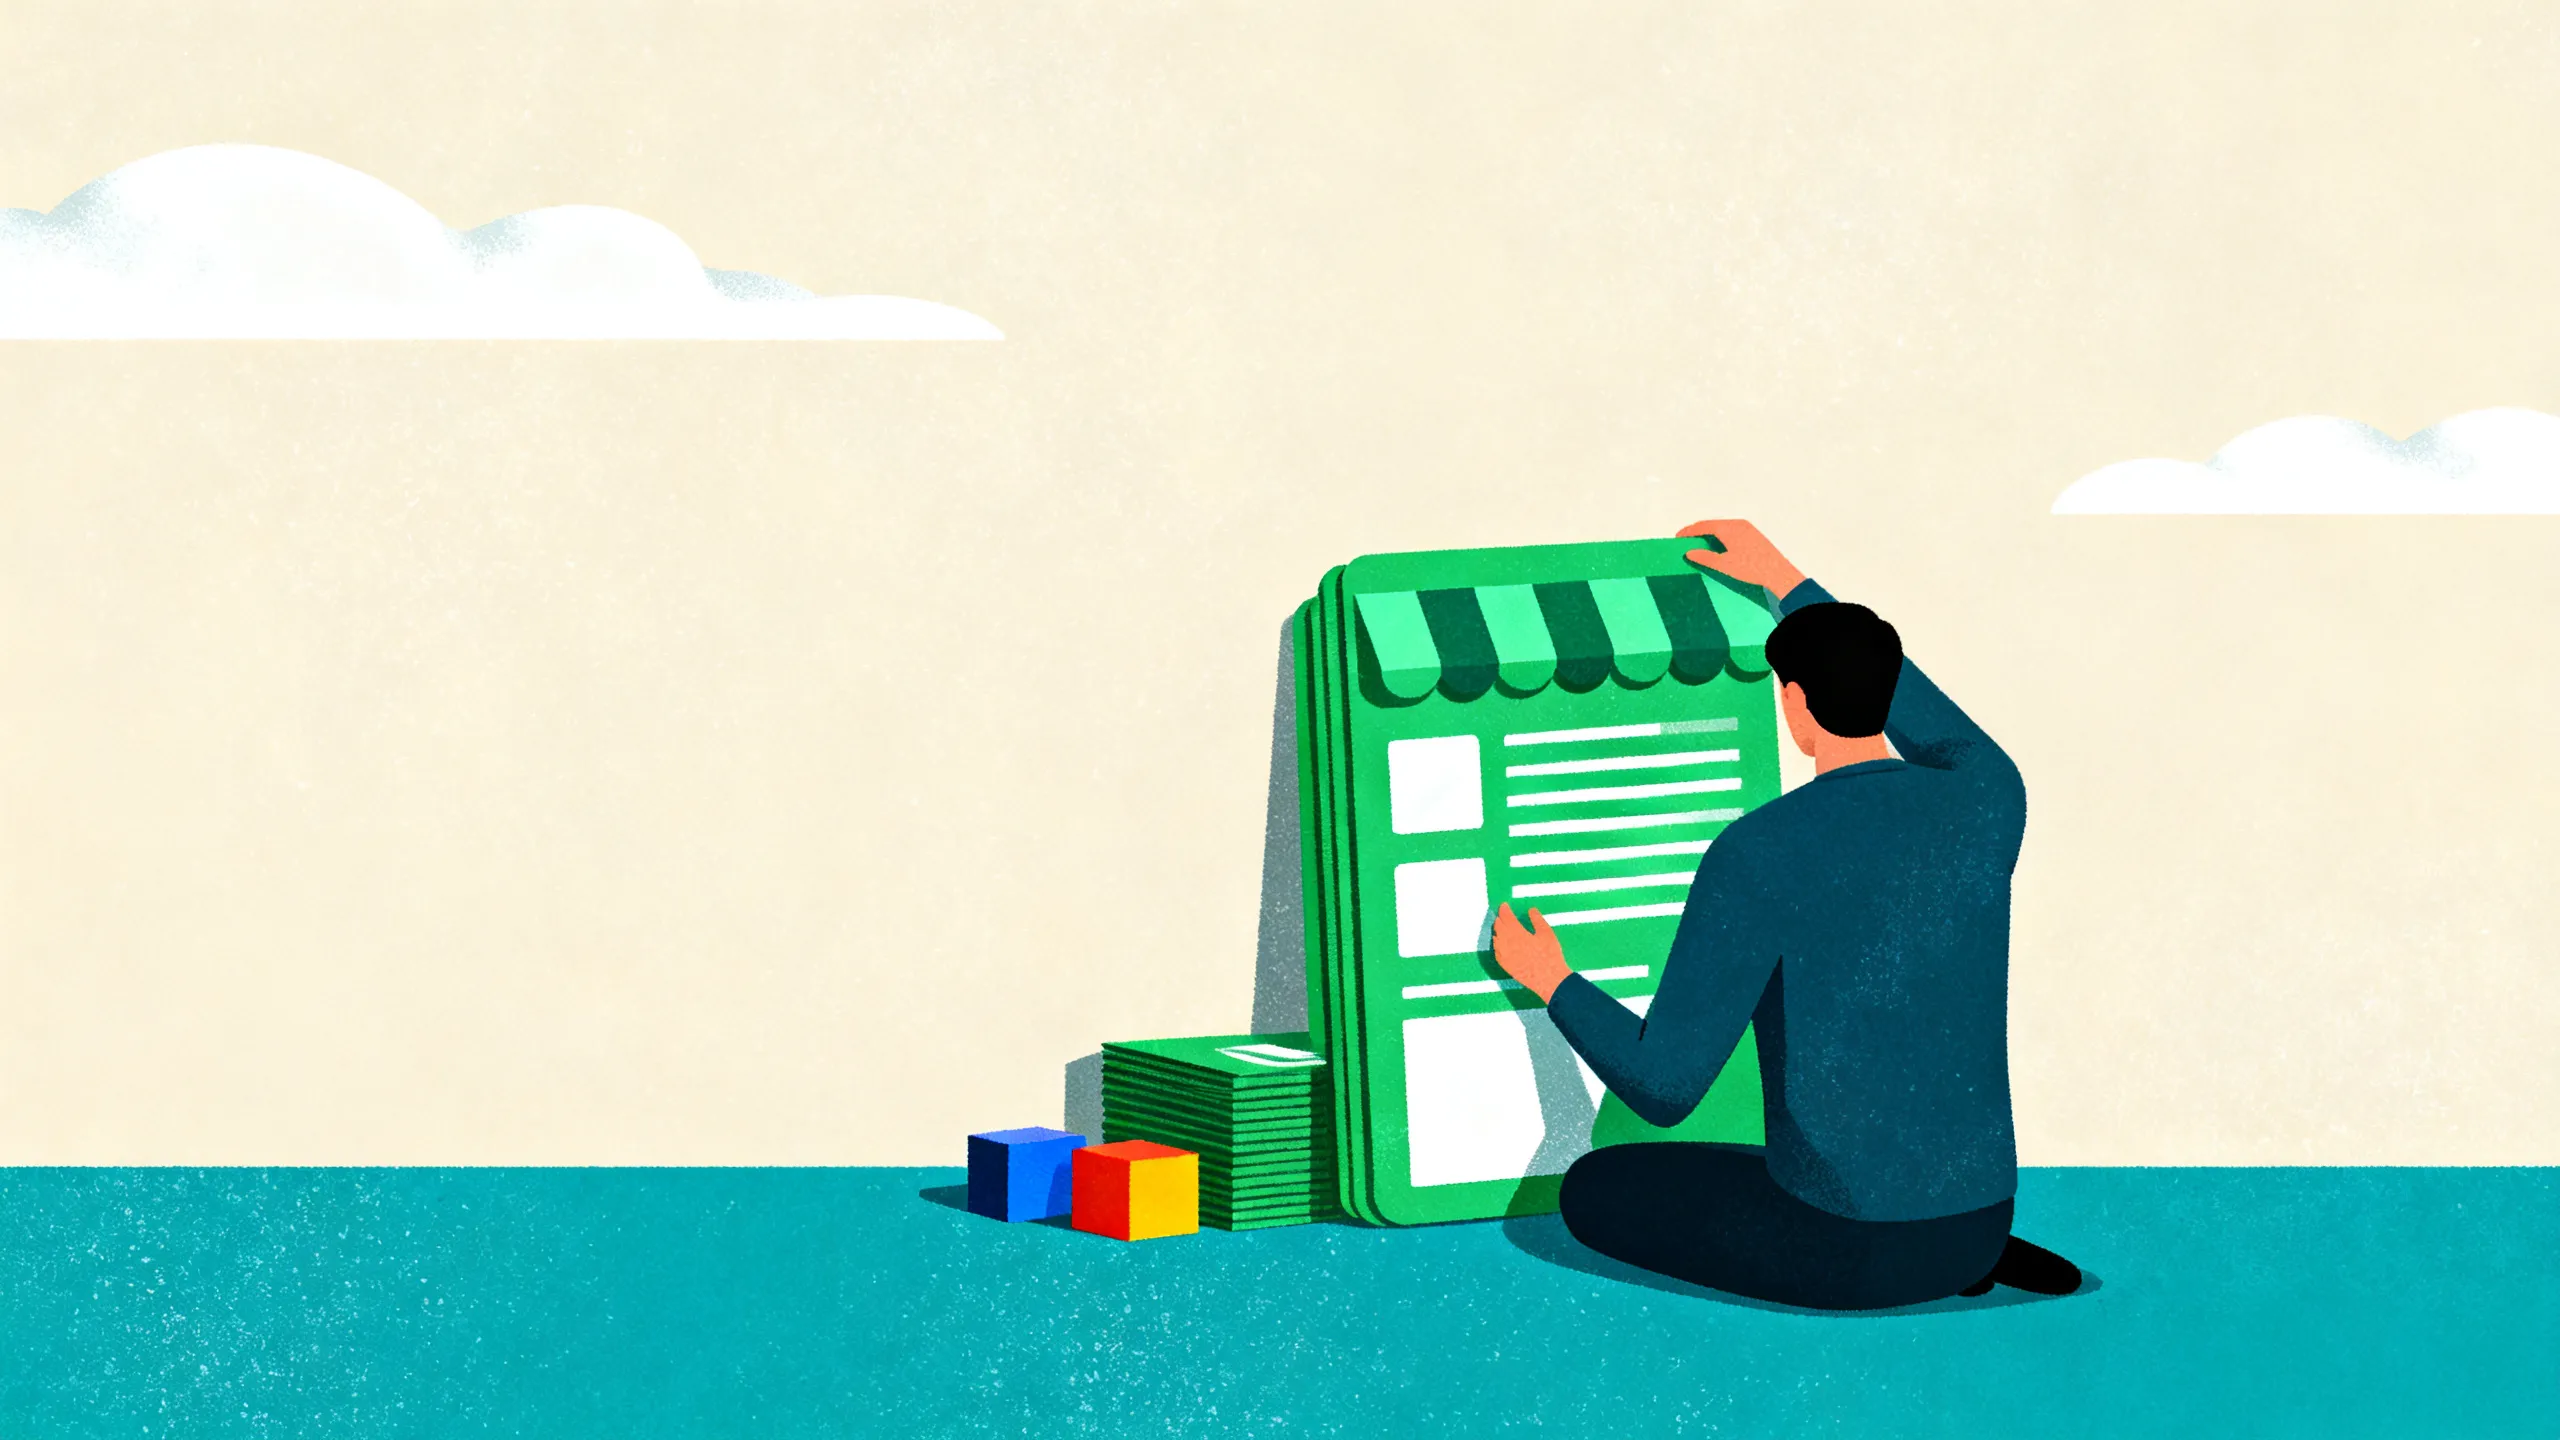
How to Get Users for Your Shopify App
How to get users for your Shopify app by finding merchants with matching apps, gaps, traffic, pixels, Plus signals, and contacts.
We analyzed 347,101 Shopify stores to find which app combinations correlate with growth. Support + Loyalty shows a 20x lift at higher traffic tiers.

Some links in this article are affiliate links. We may earn a commission if you purchase through them, at no extra cost to you. We only recommend tools we've actually tested.
Every "best Shopify apps" article gives you the same thing: a list of 15-50 individual apps, organized by category, based on the author's opinion. Some include screenshots. None include data on which apps actually appear together in growing stores.
We took a different approach. Instead of asking "which apps are good?" we asked: "which app combinations correlate with stores being at higher traffic tiers?" We analyzed 347,101 Shopify stores, measured app co-occurrence across categories, and identified the specific combinations that are disproportionately present in higher-traffic stores.
The result is a data-backed map of the Shopify "growth stack," the combination of tool categories that separates stores doing 200K+ monthly visits from those stuck under 50K.
We scanned 347,101 active Shopify stores using automated headless browsers. For each store, we detected installed apps and categorized them into functional groups: email marketing, reviews, customer support, upsell/cross-sell, loyalty, analytics/attribution, subscriptions, and others.
We then measured adoption rates for each category at every traffic tier, computed co-occurrence rates for category pairs and triples, and calculated the "adoption lift" (how much more common a combination is at 50K+ traffic versus under 50K).
Important caveat: This is correlation data, not causal evidence. Stores at higher traffic tiers have more revenue and can afford more tools. The data doesn't prove that adding these apps will cause growth. What it does show is which tool categories become standard as stores scale, and which combinations you should prioritize if you're building toward that growth.
Limitations: Our scanner detects client-side apps via script signatures and DOM patterns. Backend-only tools are likely undercounted. Some stores use built-in Shopify features (like Shopify Email) that don't register as dedicated app installs.
Before looking at specific combinations, the first pattern is clear: stores add more app categories as they grow. Not just more apps, but more functional categories.
| Traffic Tier | Avg App Categories | % With 1 Category | % With 5+ Categories |
|---|---|---|---|
| Under 50K | 1.82 | 42% | 5% |
| 50K-200K | 4.04 | 8% | 38% |
| 200K-1M | 5.52 | 3% | 58% |
| 1M-5M | 6.18 | 2% | 33% |
The jump from under 50K to 50K-200K is the sharpest: stores more than double their app category count. This is the "optimization inflection point" where stores move from basic setup to active growth investment.
42% of stores under 50K traffic run apps from just one functional category. By contrast, 58% of stores in the 200K-1M tier run five or more categories. The depth of your tech stack is one of the clearest indicators of store maturity.
As stores grow, they don't add app categories randomly. There's a consistent order:
This ladder tells you what to prioritize. If you're a store owner deciding what to add next, or an agency recommending a stack, follow the order. Don't skip ahead to loyalty apps before you have email and reviews covered.
For a stage-by-stage breakdown of exactly what stores install at each traffic level, see our tech stack by growth stage study. For the overall vendor leaderboard those pairings sit inside, see our Shopify app market share study.
Before looking at combinations, we measured which single app category has the strongest correlation with being at a higher traffic tier.
| App Category | Avg Tier With Category | Avg Tier Without | Tier Lift | 200K+ vs Under 50K Adoption |
|---|---|---|---|---|
| Analytics | +0.65 above baseline | Baseline | Strongest | 35.6x |
| Upsell | +0.63 | Baseline | Strong | 24.1x |
| Support | +0.49 | Baseline | Moderate-Strong | 11.9x |
| Loyalty | +0.42 | Baseline | Moderate | 9.8x |
| Reviews | +0.38 | Baseline | Moderate | 5.4x |
| +0.31 | Baseline | Moderate | 3.2x |
Analytics and attribution tools (like Triple Whale and Elevar) are the strongest single predictor. Stores running analytics apps are at a dramatically higher average traffic tier than those without. This makes intuitive sense: analytics tools are essential for scaling paid acquisition efficiently, and stores investing in attribution are actively optimizing their ad spend.
Upsell and cross-sell apps (like Rebuy and ReConvert) are the second strongest predictor. These tools are nearly absent at the under-50K tier but common at 200K+, which signals they're an investment stores make once they have enough order volume to justify the optimization.
Email marketing, while the most widely adopted category overall, has the weakest growth correlation (+0.31). This isn't because email is unimportant. It's because email apps are common across all tiers, so the presence of an email app alone doesn't differentiate high-traffic stores from low-traffic ones.
Individual categories tell part of the story. Combinations tell the rest. We measured how frequently each two-category pair appears at stores with 50K+ traffic versus stores under 50K.
| Combination | Lift at 50K+ vs Under 50K | Interpretation |
|---|---|---|
| Support + Loyalty | 20.0x | The strongest pair. Stores investing in both retention and service are overwhelmingly high-traffic. |
| Reviews + Upsell | 16.8x | CRO power combo. Reviews build trust, upsell captures value. Rare below 50K. |
| Email + Upsell | 7.5x | Email drives traffic back, upsell maximizes each visit. Strong mid-tier signal. |
| Email + Reviews | 4.8x | The "foundation" combo. Most common starting pair, but still 4.8x more common at 50K+. |
| Email + Support | 6.2x | Retention-focused combo. Stores that invest in both acquisition (email) and service. |
| Reviews + Loyalty | 12.4x | Trust + retention. Common among stores with repeat-purchase models. |
The Support + Loyalty combination is 20x more common at stores with 50K+ traffic than at stores below 50K. That's the strongest signal in our dataset. Why? Because both categories represent investments in customer retention, and retention only becomes a priority once a store has meaningful traffic and revenue to protect.
Reviews + Upsell (16.8x) is the second strongest pair. This combination attacks conversion from two angles: reviews reduce purchase anxiety while upsell increases average order value. Stores that have both are actively optimizing their funnel, which is rare below 50K traffic.
Email + Reviews (4.8x) is the most common foundation combo and the logical starting point for any store. If you only have budget for two app categories, start here.
We defined progressive "CRO stacks" and measured their adoption at each traffic tier:
| Traffic Tier | % of Stores With Basic CRO |
|---|---|
| Under 50K | 0.6% |
| 50K-200K | 12.8% |
| 200K-1M | 21.1% |
| 1M-5M | 25.3% |
Even the basic CRO stack (email marketing + product reviews + customer support) is present in less than 1% of stores under 50K traffic. At 200K-1M, it climbs to 21%. This three-category foundation is the minimum for stores serious about growth, yet 99.4% of smaller stores are missing at least one piece.
The full five-category growth stack appears in only 293 stores across our entire 347K-store dataset. That's 0.08%.
But those 293 stores have the highest average traffic tier of any combination we measured: 2.07, which is +0.85 above the overall baseline. The full stack isn't common, but it's strongly associated with being a high-traffic, high-performing store.
For agencies, this gap is an opportunity. The CRO checklist study covers the tactical implementation of each category. The service gap analysis quantifies the market size for each missing piece.
Beyond categories, we looked at which specific named apps appear together most frequently. After filtering out payment provider pairs (Visa, Mastercard, Apple Pay, etc.), the top pairs are:
| App Pair | Stores Together |
|---|---|
| Klaviyo + Judge.me | 11,925 |
| Klaviyo + Gorgias | 5,800+ |
| Klaviyo + Rebuy | 3,200+ |
| Omnisend + Judge.me | 2,900+ |
| Klaviyo + Yotpo | 2,700+ |
| Klaviyo + Smile.io | 2,400+ |
| Klaviyo + Recharge | 2,100+ |
Klaviyo dominates. It appears in nearly every top pair, which reflects its position as the most-adopted email marketing tool for mid-to-high-traffic Shopify stores. For stores choosing their first email platform, Klaviyo's ecosystem of integrations with review, support, and loyalty apps is a meaningful advantage.
Judge.me is the most common reviews partner across email platforms. Its combination with Klaviyo (11,925 stores) and Omnisend (2,900+) makes it the reviews app most likely to be found alongside email tools. This co-occurrence pattern is useful for app developers looking to build integrations: if you're building a new app in any category, ensuring you integrate well with Klaviyo and Judge.me covers the largest install base.
For detailed comparisons of the apps in each category, see our studies on review apps, email apps, support apps, and upsell apps. For vertical-specific breakdowns, see our studies on beauty stores, fashion stores, food stores, home stores, and jewelry stores.
These combinations are your prescription stack. When you pitch a Shopify store, don't just sell one service. Diagnose which categories they're missing from the growth stack and propose a phased implementation plan.
Start with the foundation (email + reviews), then layer in support, upsell, and loyalty over 6-12 months. Each phase is a new retainer opportunity. Our agency pricing guide covers how to price these service layers, and our how to start a Shopify agency guide walks through the full client acquisition process.
The data also gives you a powerful personalization angle for outreach: "I noticed your store runs Klaviyo but has no reviews app. Stores at your traffic level with email + reviews see a 4.8x adoption lift compared to email alone."
Build integrations with the apps your users already have. If you're developing a loyalty app, your users most likely also run Klaviyo and Judge.me. Deep integration with those tools (shared data, triggered flows, unified dashboards) gives you a competitive edge.
The co-occurrence data also reveals market sizing for your app category by traffic tier. If your app targets upsell and you see 24.1x adoption growth between under-50K and 200K+ stores, your ideal customer is a store on the verge of that traffic threshold.
Follow the adoption ladder. Don't install 15 apps at once. App bloat costs money and slows your store. Instead, build your stack progressively:
Each phase should correspond to a traffic milestone. Don't invest in analytics attribution tools until you're spending enough on ads to justify the cost. Our tech stack by growth stage guide maps specific apps to specific traffic levels.
It depends on your traffic tier. Stores under 50K traffic average 1.82 categories, while stores at 200K-1M average 5.52. A reasonable target is to match or slightly exceed the average for your tier. If you're at 50K-200K traffic and only run 2 categories, you're behind the curve. See our app bloat study for the ceiling where more apps start hurting performance.
Email marketing + reviews. This is the most common foundation across all traffic tiers and shows a 4.8x adoption lift at 50K+ stores. Klaviyo + Judge.me is the single most popular specific pair (11,925 stores). Start there and add categories as your traffic grows.
We can't prove causation from this data. What we can say is that stores at higher traffic tiers consistently run more app categories, and specific combinations (like support + loyalty) are 20x more common at 50K+ stores. The most likely explanation is a feedback loop: stores invest in tools as they grow, and better tools help them grow faster. The practical takeaway is the same either way: build toward the growth stack progressively.
Analytics and attribution tools (Triple Whale, Elevar, Northbeam) are investments in measurement precision. Stores running these tools are typically spending heavily on paid acquisition and need accurate attribution to optimize ad spend. The 35.6x adoption lift reflects that analytics tools are nearly absent in small stores but standard in high-traffic operations.
The full growth stack is email + reviews + support + upsell + loyalty. Only 293 stores (0.08%) in our dataset run all five. Those stores have the highest average traffic tier of any combination we measured. The rarity suggests most stores leave significant optimization on the table, even large ones.
Yes, but the answer isn't "fewer apps." It's "fewer useless apps." Our app bloat study found that stores with too many apps suffer performance issues, but the growth stack categories (email, reviews, support, upsell, loyalty) each serve a distinct function. The problem is redundant apps within the same category, not having too many categories.
OptiMonk's benchmark of the top 1,000 Shopify stores found an average of 13.56 apps per store. Our data across 347K stores shows an average of 2.7 apps. The gap confirms what our data shows: the top stores invest heavily in their tech stack while the vast majority operate with minimal tools. See our top stores analysis for specific adoption patterns among high-performing stores.
Analytics (35.6x lift), upsell (24.1x), and support (11.9x) show the widest adoption gaps between 200K+ traffic stores and those under 50K. These are the categories where small stores are most underinvested relative to successful stores, which means they represent the biggest optimization opportunities.
Absolutely. Filter for stores at 50K+ traffic that are missing key growth stack categories. A store with good traffic but no reviews app and no support tool has obvious buying signals. You can build an entire prospecting workflow around tech stack gaps. Our ICP framework and lead qualification guide show you how.
We focused on the six categories with the strongest growth signals. SEO apps, SMS marketing, popups, and page builders all have their place, but their adoption rates didn't show the same dramatic tier-to-tier scaling as the core growth stack categories. They're valuable additions but not the primary growth predictors.
| Finding | Data |
|---|---|
| Strongest single predictor | Analytics: +0.65 tier lift, 35.6x adoption at 200K+ vs under 50K |
| Strongest two-category combo | Support + Loyalty: 20x more common at 50K+ stores |
| Best foundation combo | Email + Reviews: 4.8x lift, most common starting pair |
| Full growth stack | Email + Reviews + Support + Upsell + Loyalty (only 293 stores, 0.08%) |
| Full stack traffic correlation | Highest average tier of any combo (+0.85 above baseline) |
| Category count at under 50K | 1.82 avg, 42% running just 1 category |
| Category count at 200K-1M | 5.52 avg, 58% running 5+ categories |
| Top specific app pair | Klaviyo + Judge.me (11,925 stores) |
| Adoption order | Email → Reviews → Support → Loyalty → Analytics → Upsell |
Search by niche, traffic, and tech stack. Export with verified founder contacts.Search stores by niche, traffic, and tech stack. Export with verified founder contacts so you can skip the research.
How to get users for your Shopify app by finding merchants with matching apps, gaps, traffic, pixels, Plus signals, and contacts.
![How Many Shopify Stores Are There in 2026? [589K Study]](/images/blog/how-many-shopify-stores-are-there.webp)
How many Shopify stores are there in 2026? We analyzed 589,043 stores by country, traffic, category, themes, apps, and contacts.
![Lead Generation Examples for Shopify [583K-Store Study]](/images/blog/lead-generation-examples-shopify.webp)
Lead generation examples for Shopify agencies and SaaS teams: 10 campaign recipes from 583,376 stores, with filters, contacts, and buyer roles.